Journal Information
Article Information
Validation of Sensory Outcome Measure: Findings from the 2011 Survey of Pathway to Diagnosis and Services
Author Information
Objective:
To evaluate item-factor structures of the 15 sensory items from the Survey of Pathways to Diagnosis and Services (Pathways) and examine the best fitting model.
Method:
The study subjects were 1,968 children aged 6-17 years, who had ever been diagnosed with Autism Spectrum Disorder (ASD) and/or Intellectual Disability (ID). Factor analyses and item response theory models were used to determine the best fitting item-factor structure of the sensory items. The Strengths and Difficulties Questionnaires (SDQ) was used to test the concurrent validity of the sensory severity estimates.
Result:
A bifactor MIRT model (a general and four sensory factors) was selected as the best fitting model. All items statistically fitted to the bifactor model (p > .01) and showed moderate correlations with all five subscales of the SDQ (rs = .31 ~.51, p < .0001). The general sensory score differentiated the four different diagnostic groups (ASD, ID, ASD with ID, and no current symptoms) [F (3,1961) = 207.4, p < .0001].
Conclusion:
The Pathways sensory items yielded reliable estimates of the general and each corresponding sensory factor by applying a bifactor MIRT model. The sensory score can be used as a valid sensory measure in the population survey.
Ⅰ. Introduction
How we perceive information from the environment through our sensory systems is how we make sense of the world([Williams, 2017]). The incoming information travels to the brain for processing. Once in the brain, the information is processed, and it is determined whether the information is not pertinent, the information is redundant and does not require a response, or action needs to be taken. The process by which we perceive information and respond or not respond is labeled as sensory processing. Sensory processing is the foundation of how one interacts with the world. If there is a disruption or dysfunction in processing the input from the environment, atypical behavioral manifestations will occur. It is estimated that between five and 17% of the population experiences a sensory processing disorder([Ahn, Miller, Milberger, & McIntosh, 2004;] [Goodman-Scott & Lambert, 2015;] [Miller, Schoen, Mulligan, & Sullivan, 2017]). [Miller, Anzalone, Lane, Cermak, and Osten(2007)] identified three subtypes of sensory processing disorders. Sensory overresponsivity occurs when an individual responds to sensory input more quickly, with more intensity, or for a longer duration. Sensory under-responsivity, also labeled as low registration, occurs when an individual does not respond or has a diminished response to sensory input([Dunn, 2014]). Sensory seeking or craving is when individuals crave or seek out an unusual amount or type of sensory input. Children who have poor sensory processing and responsiveness experience sensory stimuli in very different ways than their typically developing peers, which can affect their social, cognitive, and sensorimotor development([Dunn, 1997]).
The Survey of Pathways to Diagnosis and Services (Pathways) was conducted in 2011 to examine the utilization of medication, health care, and education services for symptoms and diagnoses of children with Autism Spectrum Disorder (ASD), developmental Delay (DD), or Intellectual Disability (ID)([Child and Adolescent Health Measurement Initiative, 2015]). The Pathways supports researchers and policymakers to investigate caregivers’ perspectives and experiences with health care services, such as unmet needs and insurance adequacy([Child and Adolescent Health Measurement Initiative, 2015]). Approximately 4,000 interviews and 3,000 written questionnaires were administered to parents of children aged 6-17 years who were ever diagnosed with ASD, DD, or ID across the United States([Child and Adolescent Health Measurement Initiative, 2015]). Information derived from this nation-wide sample could allow researchers and clinicians to better understand the various health care needs of this population so that they can develop more tailored therapeutic interventions.
The Pathways survey includes 15 sensory items, such as “unusually sensitive to certain sounds,” “extremely pleased by certain movements and keeps doing them,” “makes little eye contact,” “gets lost easily,” and “makes odd, fast movements with fingers or hands.” These items inquire about severities of sensory-related activities, behaviors, and emotions. With Pathways, it is feasible to investigate parents’ perceptions of their children’s sensory responses and impact on participation.
However, the 15 identified Pathways sensory items have not been validated, indicating that the item-factor structure of these sensory items has not been examined. This means that the number of factors, the existence of higher-order factors, and relationships between items and factors are unknown. It is not known if simply summating item scores is the best method to estimate sensory severities of the 15 items. In order to yield reliable and valid sensory severities estimates, the factor structure of the items needs to be thoroughly constructed; then, an appropriate measurement model needs to be applied.
Modern psychometric models (i.e., Item Response Theory; IRT) have been applied to various health care measures to improve the reliability and validity of the measure estimates. For example, sponsored by the National Institutes of Health (NIH), the Patient-Reported Outcomes Measurement Information System (PROMIS) group developed a wide range of patient-reported outcome measures from physical health to social health domains using IRT methodologies([Broderick, DeWitt, Rothrock, Crane, & Forrest, 2013]). Also, the Pediatric Evaluation of Disability Inventory (PEDI), the Assessment of Quality of Life (AQol-8), the Activity Measure for Post Acute Care (AM-PAC) short form were created using IRT models([Haley et al., 2011;] [Hawthorne, 2009;] [McDonough, Ni, Coster, Haley, & Jette, 2016]).
The benefits of using modern psychometric methodologies have been widely acknowledged. First, the probabilistic feature of modern methodologies allows a measure to become a sample-free measure ([Price, 2016]). This probability feature allows using mixed forms of items([Price, 2016]). Second, mathematically, IRT transforms dichotomous or ordinal responses into unbounded continuous values ([Raykov & Marcoulides, 2011]). Instead of using a sum score as a person’s level of the latent construct of interest, IRT uses logits, which are regarded as an interval scale. An interval scale allows for quantitative comparisons among examinees with additive properties and meaningful distance (e.g., how much person A is abler than person B). Item difficulties are also calculated in logits, which make it possible to compare the difficulty of items numerically. Third, IRT allows selecting the best fitting model for measure analysis([Price, 2016]). IRT models can be falsified, which means that among IRT models with different assumptions, researchers can choose the model that is optimal for the data([Raykov & Marcoulides, 2011]). By selecting the best psychometric model for the measure, the accuracy of the item and person estimates can be guaranteed.
The effective therapeutic programs and resources for advanced accountability in health care results are determined using measure outcomes([Grossman & Alper, 2013]). Since the judgment and quality of subsequent clinical services will be reduced with invalid measures, psychometric evidence, such as measures’ validity, reliability, and item-level statistics should be evaluated. Thus, the purpose of this study was to validate the 15 Pathways sensory items for its clinical and research use. The three steps conducted in this study are as follow: 1) item-factor structures were identified; 2) various IRT models were compared and tested for selecting the best fitting model; 3) concurrent validity of measure estimates using the best fitting model was evaluated with the related external outcome measures.
Ⅱ. Methods
Subjects. The survey participants were 6,090 children who ever had ASD, ID, and DD. A total of 4,032 phone interviews were completed, and 2,988 mailed surveys were completed nationally by parents/caregivers of children aged 6 to 17 years. We excluded children who did not complete the Strengths & Difficulties Questionnaire and Children’s Social Behavior Questionnaire and those who ever had a DD (n = 1,018). The final study cohort (n = 1,968) consists of children with ASD alone (n = 851), ID alone (n = 552), ID with ASD (n = 230), and those who were previously diagnosed with one or both diagnoses, but currently have no symptoms (n = 365). The children with currently have no symptoms were considered as a typically developing control group. The study utilized publicly available de-identified data, which does not require approval or oversight from the Institutional Review Board at the University of Texas Medical Branch.
Sensory items. A total of 15 sensory-related items were identified by two of the authors (KR and CH). The 15 sensory items were scored using a 3-point rating scale (1 = does not apply, 2 = sometimes or somewhat applies, and 3 = clearly or often applies), indicating that a higher score presents a more severe sensory problem.
Outcome measures. The Pathways database includes the Strengths and Difficulties Questionnaires (SDQ). This instrument was developed as a behavioral screening tool for children aged 4-16 years old([Goodman, 1997]). Previous studies reported that this instrument has good psychometric properties, and also its norms have been reported for international populations ([Li, Delvecchio, Di Riso, Lis, & Salcuni, 2017;] [Tobia & Marzocchi, 2018]). This instrument consists of five subscales, including emotional symptoms, conduct problems, hyperactivity/inattention, peer relationship problems, and prosocial behavior. Each subscale has five items and a 3-point rating scale (0 = not true, 1 = somewhat true, 2 = certainly true). A higher score indicates more problems in four of the subscales (emotional symptoms, conduct problems, hyperactivity/inattention, peer relationship problems), but in the prosocial behavior scale, a higher score indicates better social behavior.
Psychometric testing
Factor analysis. We first used a half of the randomly selected sample (n = 984) to run an Exploratory Factor Analysis (EFA) to identify a factor structure(s) for the 15 items. In this step, we determined factor structure(s) based on eigenvalues (> 1.0) and factor loadings (λ > .4) on the factor(s) ([Muthén & Muthén, 2015]). Next, we conducted a Confirmatory Factor Analysis (CFA) to confirm the factor structure(s) identified from the EFA, using the remaining random sample (n = 984). For both EFA and CFA, we utilized the Weighted Least Squares with adjustment for the Mean and Variance (WLSMV) estimation with a polychoric correlations matrix to account for the categorical rating scale of the sensory items. The model fit criteria for CFA were 1) root mean square error of approximation (RMSEA < 0.08), 2) comparative fit index (CFI > 0.95), and 3) Tucker-Lewis Index (TLI > 0.95)([Brown, 2006;] [Reeve et al., 2007]). We used Mplus 7.4 to conduct EFA and CFA([Muthén & Muthén, 2015]).
Item response theory models. Based on the results from CFA, we constructed and compared possible item-factor structures to identify the best fitting model to our data using IRT (multidimensional IRT for more than two factors) with the same fit criteria listed above for EFA and CFA. Then, a series of analyses of variance (ANOVAs) was conducted to test whether one structure performed statistically significantly better at capturing the data than the other structures (p < .01). Then, using the best-fitting model, we examined psychometric properties (i.e., item fit, item discrimination, item difficulty [most to least common], and step threshold) of the 15 sensory items. S-X2 statistic was used to test each item fit to the model (misfit: p < .01)([Orlando & Thissen, 2000]), and the Unidimensional Graded Response Model (Multidimensional Graded Response Model for a more than two factor structure) was selected to calibrate item discriminations and difficulties and step thresholds([Samejima, 1968]).
Five categories were used to classify the item discriminations; very low (0.35 <); low (0.36 ≤ and < 0.65); moderate (0.65 ≤ and < 1.35); high (1.35 ≤ and < 1.7); and very high (≥ 1.7) ([Baker, 2001]). Step thresholds represent intercepts corresponding to each graded category (category 1 to 2 and category 2 to 3). Item difficulties (most to least common sensory behaviors) and children’s sensory severity scores were estimated in the T-score metric (Mean = 50 and SD = 10). We used Reckase’s estimation model to calibrate item discriminations and difficulties and Monte Carlo EM estimation (MCEM) as an estimator algorithm for the efficient estimation process([Chalmers, 2012;] [Reckase, 2009]). The statistical program R, version 0.99.903 (mirt and ShinyItemAnalysis packages) was used for this study([Chalmers, 2012;] [Martinková & Hladka, 2019;] [R Core Team, 2013]).
Scale validation. Concurrent validity of measure estimates using the best fitting model was assessed with five subscales of SDQ using Spearman’s rank correlation. Also, we conducted a one-way ANOVA to compare sensory severity scores across four different diagnostic groups (ASD alone, ID with ASD, ID alone, and no current symptoms). SAS statistical software version 9.4 was used for data management, one-way ANOVA, and Spearman’s rank correlation (rs).
Ⅲ. Results
Demographics. The four diagnostic groups had statistically significant differences in age, age groups, gender, and race (p < .001). The mean age of the total sample was 11.9 years old (SD = 3.1), where the ASD alone group was the youngest (11.4 years old), and ID along group was the oldest (12.5 years old). Also, while ASD alone group included more boys (82.1%) as compared to girls (17.8%), ID along group demonstrated nearly even gender distributions (49.4% for boys and 50.4 for girls). Table 1
Psychometric testing
Factor analysis. An EFA supported four factors for the 15 sensory items (6.0, 1.6, 1.2, and 1.0 eigenvalues for factors 1, 2, 3, and 4 sequentially) (Figure 1). Based on the EFA results and descriptive statistics (Table 2), content experts (KR & CH) categorized 15 items into four factors and titled them with 1) sensory seeking, 2) sensory avoidant, 3) low registration, and 4) repetitive behaviors. Following, a CFA confirmed the four factors with excellent model fit values (RMSEA = 0.05, CFI = 0.978, TLI = 0.972) and high factor loadings (.518 < λ < .914). Table 3 provides factor loadings on the four factors from the CFA.
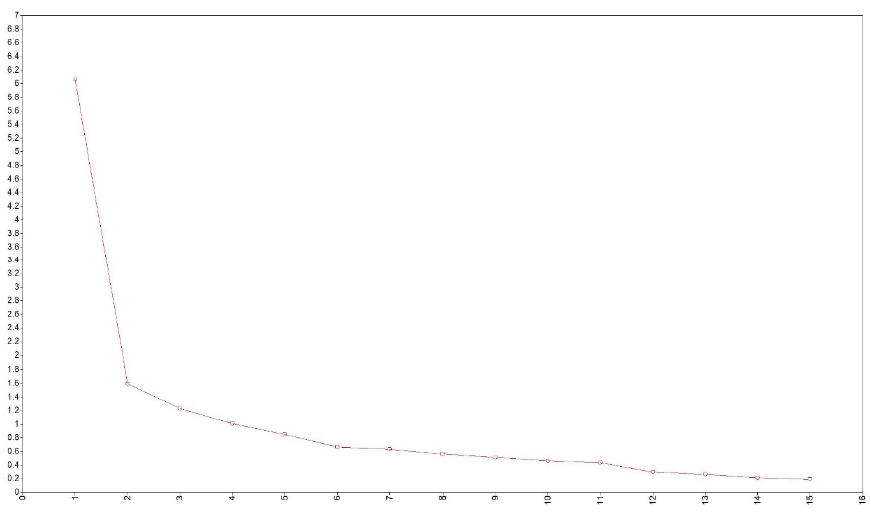 Figure 1Exploratory Factor Analysis Scree Plot from a Random Sample (n = 984)
Identifying the best item-factor structure. We used Multidimensional IRT models to compare the four possible item-factor structure 1) four unidimensional models, 2) four unidimensional models with correlations, 3) a hierarchical multidimensional model, and 4) a bifactor model (Figure 2).
 Figure 2Possible Item-Factor Structures among the 15 Sensory Items
In model comparisons, the bifactor model demonstrated the best fit (RMSEA = 0.03, CFI = 0.992, TLI = 0.988) among the four item-factor structures. The fit statistics for the four unidimensional models and the four unidimensional models with correlations were; RMSEA= 0.132 and 0.123, CFI = 0.807 and 0.832, TLI = 0.768 and 0.798 sequentially, and the higher-order multidimensional model was not reliably converged (non-positive definite variance-covariance matrix). Following, ANOVAs among three reliably estimated item-factor structures showed that the bifactor model was a statistically significantly better fit to the 15 sensory items (p > .001) than the remaining two models (p < .001). As a result, the bifactor model was selected to investigate item psychometric properties, which included item fit statistics, item discriminations, item difficulties, and step thresholds for this study.
Psychometric properties of sensory items. All items adequately fit the bifactor model (p > .01), where a general sensory factor and one of four specific sensory factors (sensory seeking, sensory avoidant, low registration, and repetitive behaviors) estimated item responses. Having a greater discrimination of the general sensory factor than that of the specific factor indicates that item responses are influenced by the general factor more than the specific sensory factor. For example, D02 (Extremely pleased by certain movements and keeps doing them, for example, turning around and around) has a discrimination value of 1.53 for the general sensory factor and 0.74 for the sensory seeking factor (Table 4). This indicates that individuals’ general sensory factor scores have a greater impact on the responses of D02 than the sensory seeking factor scores. Among a total of 15 items, the general sensory factor demonstrated more substantial influences on six items (D02, D15, D01, D07, D12, and D14) than the responding specific sensory factor. At the overall level of discrimination (MDISC), all items showed moderate or greater discriminations (MDISC); moderate (D01, D07, D11, and D12), high (D02, D03, D10, and D15), or very high discriminations (D04, D05, D06, D08, D09, D13, and D14).
The most difficult (least common) item was D07 (66.66 T-scores, Dislikes physical contact), closely followed by D15 (64.16 T-scores, Sways back and forth) and D11 (62.86 T-scores, Gets lost easily, for example, when out with someone). The top three easiest (most common) items were D09 (47.45 T-scores, Has difficulties doing two things simultaneously, for example, he/she cannot dress and listen to parent at the same time), D10 (48.15 T-scores, Has difficulty taking in information; information is heard but does not sink in), and D01 (52.43 T-scores, Unusually sensitive to certain sounds, for example, always hears certain sounds earlier than other people). Detailed information on psychometric qualities of sensory items and an item-person map are provided in Tables 4 and 5 and Figure 3.
 Figure 3Item-Person Map (Wright Map)
Scale validation. The general sensory score demonstrated moderate correlations with the SDQ five subscales: emotional symptoms (rs = .31, p < .0001), conduct problems (rs = .32, p < .0001), hyperactivity/inattention (rs = .51, p < .0001), peer relationship problems (rs = .41, p < .0001), and prosocial behavior (rs = -.39, p < .0001), respectively. The one-way ANOVA revealed that there was a statistically significant difference among the four comparison groups in the general sensory score, F (3,1961) = 207.4, p < .0001. Figure 4 presents the mean general sensory scores across the four groups. A Tukey post-hoc test identified significant differences in all pair-wise comparisons (p < .0001). While children who do not have current symptoms showed the lowest mean general sensory score, children with ASD and ID demonstrated the highest means general sensory score, meaning those children with ASD and ID had more sensory problems compared to the other diagnosis groups. The findings indicate that the general sensory score differentiates these four diagnosis groups.
 Figure 4General Sensory Scores (Mean, Standard Error) across the Four Diagnostic Groups
Ⅳ. Discussion
The validation of the Pathways sensory items in differentiating diagnostic groups supports the differences in sensory processing behaviors seen in these diagnostic groups. The scale resulted in four factors, which were labeled 1) sensory seeking, 2) sensory avoidant, 3) low registration, and 4) repetitive behaviors. Although slightly different in composition, the factors are similar to those found in the Sensory Profile 2([Dunn, 2014]) and sensory responsiveness patterns identified by [Miller et al.(2017)]. Research by [Engel-Yeger et al. (2016)] found that low registration predicted anxious and irritable affective temperaments, which is consistent with the items that factored into low registration (difficulty doing two things, difficulty taking in information, gets lost easily, and overreacts to everything and everyone).
We also found that the repetitive behaviors factor (flaps hands/arms, sways back and forth, and odd fast movements with fingers) was separate from the sensory seeking factor. Repetitive behaviors have been included with sensory seeking in previous assessments([Dunn, 2014]). This discrepancy, compared to previous research, suggests that these restrictive repetitive behaviors are essentially different from the other behaviors that grouped with sensory seeking. In another study, anxiety was associated with the restrictive repetitive behaviors([Joyce, Honey, Leekam, Barrett, & Rodgers, 2017]). Perhaps the repetitive behavior factor and sensory seeking factor in this analysis are separate because the repetitive behavior is associated with anxiety and the other sensory seeking items are not.
A bifactor MIRT model adequately fit the 15 Pathways sensory items, suggesting that all 15 items were concurrently explained by the general sensory factor and each corresponding sensory factor. No misfit and ceiling/floor items demonstrate that ASD alone, ID alone, ASD with ID, and no current symptom children’s sensory severities can be reliably predicted with these 15 sensory items. General sensory scores showed good concurrent validity with all five subscales of SDQ and reliably separated four different diagnosis groups in expected hierarchical ranks (ASD with ID > ASD alone > ID alone > do not have current symptoms). Our study represents that general sensory scores produced by the bifactor MIRT model adequately reflect our theoretical expectations.
The children with ASD and ID demonstrated the highest mean general sensory scores, those with ASD were second, those with ID were third, and those with no symptoms showed the lowest score. [Little, Dean, Tomchek, and Dunn(2016)] demonstrated that children with ASD showed significantly different patterns in sensory processing as compared to those with ID. In a study by [Joosten and Bundy (2010)], the children with ASD and ID scored lower than ID alone and both of those groups scored lower than typically developing children. Although the research comparing sensory processing between ASD alone, ID alone, and ASD with ID is scant, it suggests more severity of symptoms with the dual diagnosis of ASD and ID, followed by ASD, then ID, and finally typically developing.
Item-level information of the sensory items can provide clinicians with an in-depth understanding of children’s sensory severities. Specifically, the four least common sensory items were from each of the four factors: D07 (sensory avoidant factor: dislikes physical contact), D15 (repetitive behavior factor: sways back and forth), D11 (low registration factor: gets lost easily, for example, when out with someone), and D03 (sensory seeking factor: smells objects). These behaviors represent less common sensory behaviors for children with ASD, ID, ASD with ID and no current symptoms. On the other hand, the low registration factor’s two items, D09 (has difficulties doing two things simultaneously) and D10 (has difficulty taking in information; information is heard but does not sink in), were the most common sensory items. These items could be typical sensory behaviors for children with milder sensory processing problems. However, this study did not conduct differential item functioning for different diagnostic conditions (ASD, ID, ASD with ID, and no current symptoms), so critical differences among conditions might exist and have been omitted in the analysis. Future research is recommended to investigate this speculation.
Ⅴ. Limitations
Inherent bias from a secondary analysis of survey data is a potential limitation of this analysis. The greatest limitation of secondary data use is that the data have been collected for another purpose([Boslaugh, 2007;] [Johnston, 2017]). It is possible that critical sensory items might not have been included in the 15 sensory items found in this data set. For example, seems unaware when people come into the room was included in the Sensory Profile 2([Dunn, 2014]), but not in our 15 sensory items. However, the purpose of this study was to identify the methods to produce reliable estimates of sensory severity using the existing 15 sensory items rather than to create a validated standardized sensory severity measure. Even though we acknowledge that the 15 sensory items may not be used as a clinical measure, we believe that the information derived from the items will allow us to assess the influence that sensory severity has on participation within the diagnostic groups within the study.
A further limitation of this study is the use of a group of children who have previously been diagnosed, but have no current symptoms, as a proxy for a typically developing control group. This is not as strong as having a control group who have never had a diagnosis, but is the closest to typically developing children included in the dataset. Additionally, we used parent report instead of a confirmatory diagnostic assessment to identify each child’s diagnosis, which was not possible with this secondary data. Also, we used the SDQ as a validation tool for the sensory scale, which is not as strong as using one of the current published sensory processing tools as a validation measure. Because the study used secondary data from the Pathways survey, it was not possible to use an already published sensory assessment for validation.
It should be noted that the higher-order multidimensional model was not converged. This could be due to missing data, small sample sizes, or linear dependency in the dataset. Considering only less than 0.01% of missing responses were included in our data, missing data is seemingly not the cause of this estimation error. Future study is warranted to attempt different estimation algorithms to inspect this error.
Ⅵ. Conclusion
With a bifactor MIRT model, the 15 Pathways sensory items can provide reliable estimates of the general sensory factor and each corresponding sensory factor. A certain level of children’s sensory severity scores may negatively influence an outcome of interest such as participation. This study proposed a feasible method to use the 15 sensory items to quantify sensory severity, which could potentially guide researchers and clinicians in tailoring therapeutic interventions for specific diagnostic groups.